Table of Contents
1 - Introduction2 - Profiling your application
3 - User interface reference
1 - Menus
2 - Toolbar
3 - Session tabs
4 - Overview panes
5 - Event views
6 - Information panes
7 - Dialog windows
4 - SDK Reference2 - Toolbar
3 - Session tabs
4 - Overview panes
5 - Event views
6 - Information panes
7 - Dialog windows
Contact Information
Sales
Sales and licensing related questions should be sent to our sales team at:Feedback
If you have feedback regarding this website or any of our products, please use the following email address:Support
Questions related to problems you have encountered with either this website or any of our products should be directed to our support team at:Enquiries
Any other questions, or general enquiries should be sent to the following email address:3.4.2 - Callstacks
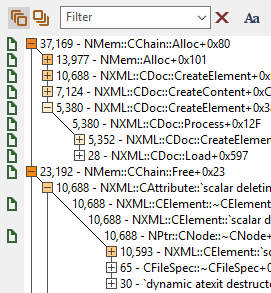
 The callstacks view collapses all callstacks from all events in the profile into a single tree where each item in the tree represents a single stack
frame, and where each level of the tree is sorted according to how many times each stack frame appears in events in the profile.
The callstacks view collapses all callstacks from all events in the profile into a single tree where each item in the tree represents a single stack
frame, and where each level of the tree is sorted according to how many times each stack frame appears in events in the profile.As with any other tree view, you can expand and collapse items in the tree by clicking on the box next to each item. The colour of the box gives an indication of how often each item appeared in the profile. The more orange the box, the more allocation events that that stack frame has been linked to.
When an item has a green file icon next to it, you can click on that icon to open the source code associated with that stack frame.
Click on the text of an item in the tree to create a filtered view using that stack frame as the filter match data. Alternatively you can Ctrl+Click on an item to add that item to the currently active filter.
As seen in the image on the right, the top part of this pane contains a toolbar with some options to help control the callstack and its items:
