3.7.5.10 - Thread filter
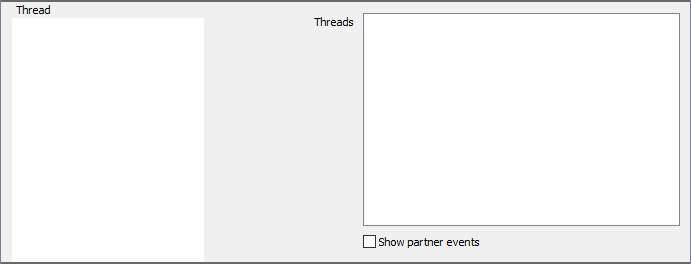
A thread filter only shows memory events from specific threads.
| Threads |
Select the threads you wish to view to enable this filter.
|
| Show partner events |
If this option is enabled partner events will also be shown even if they don't occur in any of the selected threads. For example, if an allocation
event occurs in one of the selected threads, but its associated free event doesn't, both events will appear in the thread streams if this option is
selected.
|
By default threads will only be listed by their thread identifiers. You can add names to a thread by calling the
OsoMP_ThreadName function while profiling. It should be noted that this function must be called from the associated thread.