
3.5.3 - Memory maps
The secondary main view in the Oso Memory Profiler contains the memory fragmentation maps. This view gives you a top level overview of where your memory blocks are located within your application's virtual address space.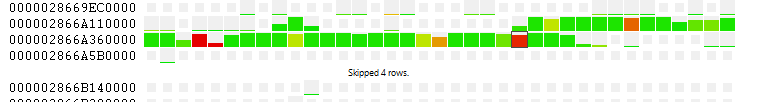
Each cell in the top map represents 64KB page of addressable memory.
A small grey cell indicates that no memory blocks have been allocated in that region of memory. As soon as a single byte of memory is allocated in a region of memory it will change to a larger grey cell. As more memory in a cell is used, the grey will be filled up with colour showing how much of that 64KB page is currently in use.
The colour in a cell will attempt to show how much fragmentation is occurring within that memory page. The colour will range from green (no fragmentation) to red (extreme fragmentation).
Click on a cell to view the layout of allocated blocks within that page.
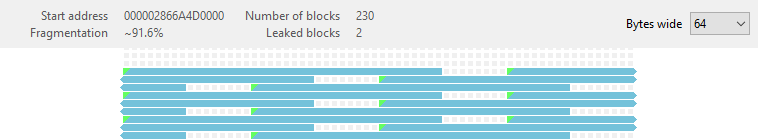
In the bottom memory map, you can see individual bytes within a 64KB page, and where allocated memory blocks are located within that region. As in the event streams, memory blocks will be coloured according to their block type.
Additionally, the top left corner of each memory block will be coloured green (valid), yellow (warnings), or red (errors) to give an indication of its validity.
The bar at the top of the view will contain some statistics about the currently selected page, and a drop list on the right which allows you to change the number of bytes that will be displayed on each row. The Auto setting will fill the entire view horizontally, while the other settings allow you to specify an explicit width.
Click on a memory block to view its details in the information panes on the right of the Oso Memory Profiler window.