Products
Oso Memory Profiler
1.2.875
Introduction1.2.875
Features
Downloads & Changes Free Trial
Licence Generator
User Manual
Newsletter
Slightly less regularly than a blue moon, we release new products into an unsuspecting world.If you would like to hear about those products first, enter your email address below and click subscribe to be added to our newsletter.

 Oso Memory Profiler - Callstacks
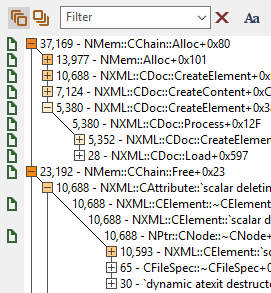
 The middle tab in the left side of the Oso Memory Profiler window contains the callstacks view.
This view collapses the callstacks of every event in the profile into a single tree where each item in the tree represents a single stack frame, and each level of the tree is sorted according to how many times each stack frame appears in events.
As you can see in the image on the right, stack frames that are hit more often are colour coded accordingly, and the frequency in which a stack frame is hit is also listed.
Callstacks can be viewed top-down or bottom-up, depending on how you like working, and can be filtered to make it easier to concentrate on one particular part of your application if required.

